
Peel back every layer.
Each scroll reveals a deeper data stratum — surface KPIs give way to underwriting segmentation, claims triangles, and capital stress tests.
Monthly premium volume (USD millions)
Built for the professionals who can't afford to be wrong.
Three distinct workflows. One platform. Zero stale data.
Your model updates before the call begins.
Stop rebuilding coverage models from quarterly PDFs that were stale before they were sent. Ticker streams live underwriting ratios directly into your workflow — loss ratios, expense triangles, and reserve adequacy, all auditable and timestamped.
Start Coverage ModelTrusted by analysts covering
The data never sleeps. Neither does the validation.
Institutional-grade data infrastructure built to the same standards as the carriers it monitors — regulatory-compliant, actuarially validated, and fully auditable from source filing to your screen.
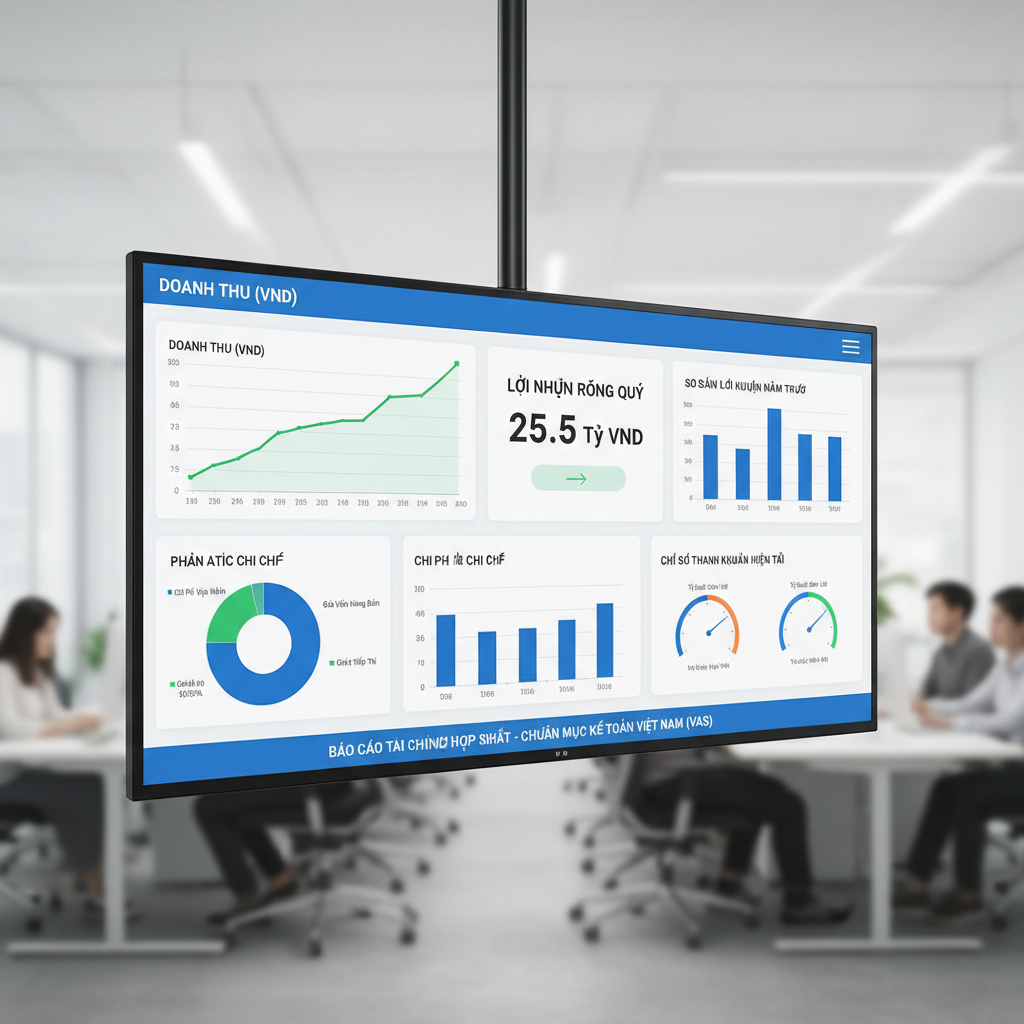
From regulatory filing to dashboard in under a second.
Ticker monitors 14 regulatory data feeds simultaneously — NAIC quarterly statements, Lloyd's Syndicate returns, Bermuda Monetary Authority filings, and SEC 10-K/10-Q insurance schedules. Every new document triggers an automated extraction pipeline that normalizes data to a unified schema within 800ms.
Every number signed, timestamped, traceable.
Board members presenting to audit committees and investors conducting regulatory due diligence need more than a number — they need a chain of custody. Ticker generates cryptographic audit logs for every data transformation, so any metric on your dashboard can be traced back to its source filing in three clicks.

Sub-Second Ingestion
Regulatory filings, statutory reports, and cat model outputs processed within 800ms of publication. NAIC, Lloyd's, and Bermuda Form data unified into a single schema.
Auditable Chain of Custody
Every data point carries a cryptographic timestamp and source citation. Board members and auditors can trace any metric back to its original regulatory filing.
Actuarial Validation Layer
An independent actuarial review engine cross-checks reserve triangles and loss development factors against industry benchmarks before data reaches your dashboard.
Cat Model Integration
RMS RiskLink, AIR Touchstone, and Karen Clark & Company models refresh overnight. Combined ratio adjustments propagate automatically as modeled loss estimates update.
The data is already moving.
Are you watching?
Request access to a live portfolio view. Three steps. No PDF. No wait. Just the numbers, already current.
Not ready to commit? Download a 12-page sample portfolio analysis — real carrier data, redacted for distribution — to evaluate data depth before requesting access.
- Live loss ratio dashboard · Real-time
- Combined ratio trend · 36-month history
- Claims development triangle · Full
- Cat exposure heatmap · Peril-level
- Capital adequacy stress tests · 5 scenarios
- Exportable audit log · Board-ready